Stakeholder coverage wins accounts.

Relationship mapping is how you see it.

Definition

What is relationship mapping?

Relationship mapping is the structured practice of identifying, classifying, and visualizing every stakeholder inside an enterprise account who influences a buying decision — and scoring how strong your team's relationship is with each of them. A relationship map is the artifact: a view of the buying committee that combines reporting structure, role in the decision, and connection strength to your team in a single picture.

It is not a contact list. A contact list records who exists. A relationship map records who matters, what role they play, and where the gaps in your coverage are. Most enterprise sales teams already have the contact list — names, titles, emails, sometimes phone numbers, sitting on the Salesforce contact object. Almost none of them have, in the same system, a structured view of which of those contacts is a decision-maker, which is an influencer, which is quietly blocking, and which would actually defend the deal in a meeting the seller is not invited to.

The discipline is sometimes called stakeholder mapping or buying-committee mapping. The work is the same: turning the people inside an account from a list into a map.

Why now

Why relationship mapping matters in enterprise accounts

Three forces have made relationship mapping more useful, not less, over the last decade.

Buying committees have grown

Enterprise B2B deals routinely involve more than a dozen stakeholders, and strategic accounts can carry twenty or more. The deal review based on the AE's gut — once viable when three people made a decision — collapses against a committee where the seller has never met half the participants. The map is the only way to see who has been covered and who has not.

Knowledge lives in heads, not systems

A KAM holds two or three years of relationship context for a strategic account in their head — who supports what, who quietly blocked the last deal, who recently moved teams. When that KAM leaves, the knowledge resets to whatever survived in CRM notes, which is rarely much. The team that won the account has to start over. Relationship mapping is the act of moving that context out of the KAM's head and into a place the next account team can pick up.

Buyers expect proactive selling

Enterprise buyers increasingly expect their account teams to know the account better than the buyer's own colleagues do — to walk in with a clear read on who needs to be aligned, what each stakeholder cares about, and where the political risk is. Relationship mapping is the structure that makes that conversation possible.

The team that wins the account is not the one with the most charismatic seller. It is the team where everyone — KAM, AE, customer success, sales engineer, executive sponsor — can see the same picture of the buying committee, and where one person leaving does not reset the picture to zero.

Stakeholder roles

The four stakeholder roles

A relationship map without role classification is a directory with arrows on it. The roles matter because they tell the team what each stakeholder needs from them — and what risk each represents.

Decision-makers

The people who can say yes. In enterprise deals, this usually means the economic buyer plus a small ring of senior approvers — heads of department, division leadership, sometimes a steering committee. The test: if this person says no, does the deal stop? If yes, they belong in this category.

Influencers

The people whose opinion shapes what the decision-makers conclude — technical leads, procurement, security, the user community lead, the consultant the CIO trusts. Influencers cannot greenlight the deal alone, but they can stall it indefinitely, and they routinely write the criteria the decision-makers will eventually apply. The test: would the decision-maker ask them before signing?

Champions and supporters

Champions actively sell your solution inside the account when the seller is not in the room. They have personal credibility with the decision-maker, something to gain from the deal closing, and the willingness to spend political capital to move it forward. Supporters are softer — they are favourable, they will speak well of you if asked, but they will not advocate uninvited. Most account teams have plenty of supporters and very few champions; the difference shows up at the buying-committee meeting where you are not present.

Blockers and detractors

The stakeholders who would prefer your deal not to happen — sometimes for principled reasons (an alternative they prefer, a strategic concern), sometimes for political ones (the deal threatens their team's mandate), sometimes for personal ones. Naming a blocker is the discipline most account teams skip; it feels uncomfortable and the stakeholder rarely declares themselves. A relationship map that has no blockers on it is almost always wrong about the account.

The categories are not airtight — a decision-maker can also be a champion, an influencer can be a blocker. The point is to classify everyone. A buying committee mapped with all five labels is far more operational than one mapped with names and titles.

Playbook

How to build a relationship map: a five-step playbook

There is no single right shape for a relationship map — different accounts warrant different layouts. But there is a sequence that works.

  1. Define the scope. A relationship map for a single deal is not the same as one for a strategic account. Be explicit. A deal-level map covers the buying committee for one opportunity; an account-level map covers every buying center across business units and geographies. Most teams start at deal scope and expand to account scope as the relationship matures.
  2. Identify every stakeholder who influences the decision. Pull contacts from CRM, but do not stop there. Walk the org chart with the customer's own materials, ask the champion for names, and make explicit what is not yet known. The first map is always missing people. That is fine — the gaps are the work.
  3. Classify each stakeholder by role. Decision-maker, influencer, supporter, champion, blocker. Do this with the account team in the room, not solo. The classification surfaces what each person on the account team knows that the others do not — and forces the conversation about which stakeholders nobody on the team has actually met.
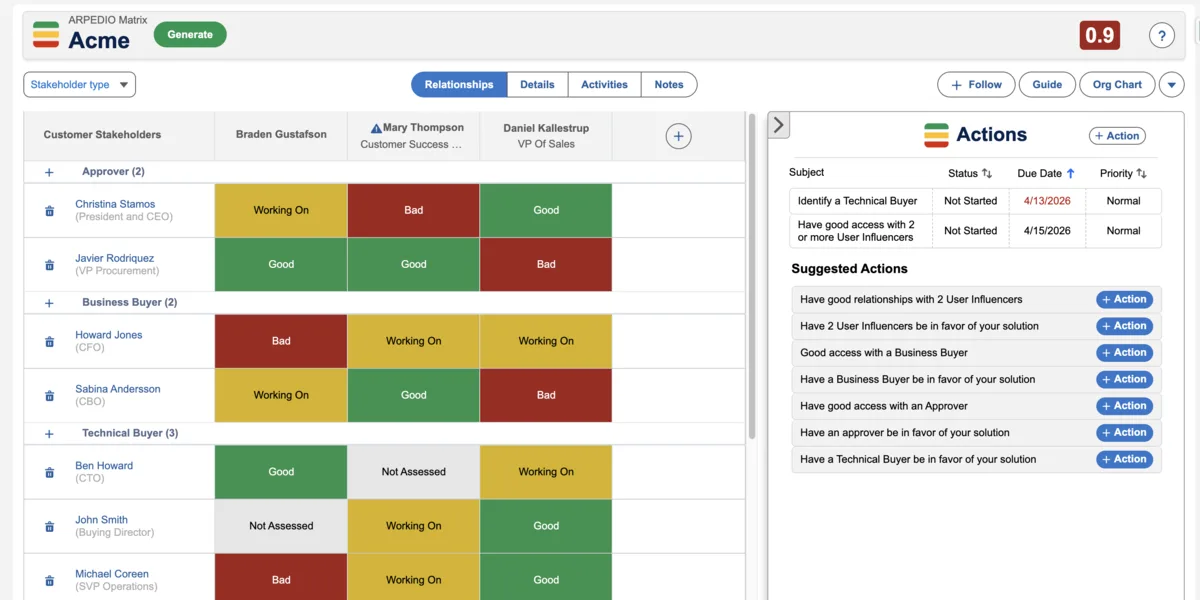
  4. Score the strength of your team's relationship with each one. A red / yellow / green scale is the most common shorthand: green means a real working relationship, yellow means a contact but not yet trust, red means weak, hostile, or absent. Score the relationship between each stakeholder and the account team — not the seller's confidence in the relationship.
  5. Connect the stakeholders to each other. Reporting lines are a good baseline; informal influence and dotted-line relationships matter more. Who does the CIO actually call before a major decision? Who does the procurement lead defer to? Lines on the map should reflect both formal and informal influence — and where the team does not yet know, that uncertainty should be visible.

The matrix below — taken from ARPEDIO's relationship view inside Salesforce — shows that exact treatment: stakeholders down one axis, account-team members across the other, cells color-coded by relationship strength. Where the matrix is mostly red, the account is exposed; where it is mostly green, the team has coverage.

Relationship matrix in Salesforce — customer stakeholders down one axis, account-team members across the other, with each cell color-coded by connection strength: green for strong, yellow for developing, red for weak or absent
A relationship matrix combines the stakeholder list with the account-team coverage in a single view. The red cells are the work — they show where the account is one resignation away from a reset.

The map only earns its keep when it is refreshed. Strategic accounts warrant a quarterly review at minimum; active deals warrant a refresh after every meaningful interaction with a new stakeholder. A map that gets built once and pasted into the account plan stops reflecting reality within a quarter.

Scope

Sales relationship mapping vs customer relationship mapping

Two terms, slightly different scope. Both describe the same underlying discipline; the difference is what the map is bounded by.

Sales relationship mapping is deal-scoped

The map covers the buying committee for one opportunity — who is involved in this decision, where the team has coverage, what the next-best action is. It sits inside deal qualification, alongside MEDDPICC and the deal-review cadence. The output is operational: pursue this stakeholder, send the executive sponsor to that meeting, get the champion in front of the economic buyer.

Customer relationship mapping is account-scoped

The map covers the entire customer relationship across business units, geographies, and time. It captures who in the customer's organization the team has met across every deal, every region, and every product line — and where the relationship is fragile, where it is strong, and where a single resignation would reset coverage. Strategic account programs run customer relationship mapping continuously, not just at deal time.

Most teams need both

The deal map is what closes this quarter; the account map is what protects revenue over years. The two are connected — every deal map should pull from and update the account map, so the work done on one opportunity compounds across the relationship rather than vanishing when the deal closes.

Running both is what separates account teams that win-and-keep from teams that win-and-churn. The second deal is harder if the team has to start the relationship from zero again.

Templates and tooling

Relationship mapping templates and software

Most enterprise sales teams build their first relationship map in a slide. The first version is fine — drawing the buying committee on a whiteboard or a slide is the right way to learn the discipline. The shape of the template matters less than getting the team to do the work together.

The two templates teams use most

The first is a stakeholder matrix — rows for individual stakeholders, columns for influence and support, cells color-coded by relationship strength. The matrix is good for small buying committees and for showing coverage gaps at a glance.

The second is a stakeholder org chart — boxes for each stakeholder, lines for reporting and informal influence, colors for role and coverage. The org chart is better for larger committees and for capturing the political structure of the account. Most enterprise teams build both views and switch between them depending on what question they are trying to answer. The stakeholder matrix guide covers the matrix view in more depth.

The three categories of relationship mapping software

When teams move beyond slides, the tools they reach for fall into three categories:

The category matters more than the specific tool. A slide is documentation; a Salesforce record is operational data. The discipline of relationship mapping survives the next reorganization only when the map lives in the system the account team already opens every day.

From slide to system of record

Doing relationship mapping in Salesforce

Moving relationship mapping from slides into Salesforce turns the discipline from a deliverable into a habit.

The map becomes a Salesforce record

Stakeholders are populated from the same contact data that already drives the rest of the CRM. Roles, relationship strength, and stakeholder-to-stakeholder connections become structured fields. When a new contact is added to the account, the map updates; when a contact leaves, the map flags the coverage gap.

Coverage is visible in pipeline review

The pipeline review opens with the relationship matrix alongside the deal forecast. Deals where the economic buyer is unknown or where the team has zero green relationships in the buying committee surface as deal risk, not as forecast confidence. The conversation shifts from "how do we feel about this deal" to "what stakeholder action would change the coverage."

The discipline survives transitions

When a KAM leaves, the next account owner inherits the map alongside the deal — who is a champion, who is a blocker, who has gone quiet, what is known and what is assumed. The new owner does not have to rebuild relationship intelligence from scratch. Two years of context survives the transition.

In ARPEDIO

ARPEDIO's Relationship Mapping & Org Chart module runs the discipline natively in Salesforce — stakeholder roles, relationship scoring, and the org-chart view as one structured object alongside accounts, opportunities, and account plans. The AI Agent layer is built lean — designed to read Salesforce data in a single pass without firing chargeable action events — to flag new stakeholders from activity history, score the strength of recent engagement, and surface the coverage gaps where a stakeholder has gone quiet.

Common mistakes

Where relationship mapping goes wrong

1. Treating it as a one-time exercise

The first relationship map is the easy part — a single workshop, a slide, a sense of accomplishment. The map is wrong by Q+1 if nobody refreshes it. The teams that get value run a structured review every 30, 60, or 90 days depending on account velocity, not when the next QBR forces them to.

2. Skipping the role classification

A map with names and reporting lines but no role labels is a directory with arrows. The work is in the labels — naming who is a decision-maker, who is a champion, who is a blocker. Teams that skip the labels because they are uncomfortable end up with maps that look thorough and tell them nothing.

3. Confusing supporters with champions

A supporter likes you. A champion sells your deal in your absence. Most account teams have plenty of supporters and few champions, and they discover the difference at the buying-committee meeting where the deal is decided without them. The relationship-strength score is fine for tracking the relationship; the role label is what names the political reality.

4. Refusing to name blockers

Naming a blocker feels uncomfortable. The stakeholder rarely declares themselves. The account team often disagrees about whether someone is a blocker or just sceptical. The cost of skipping the conversation is forecast deals lost to opposition that nobody named in advance — and a map that systematically over-states the team's coverage.

5. Building the map outside the system the rest of the account lives in

A relationship map in a slide is documentation. A relationship map as a Salesforce record is operational data. The discipline survives reorganizations, rep transitions, and quiet quarters only when the map is in the same place as the account, the opportunities, and the account plan. A map that lives in a separate tool gets opened twice a year and forgotten.

A worked example

What 18 months of relationship-mapping discipline looks like

A global industrial manufacturer running a strategic-account program across its top 30 customers. The KAM team had inherited the standard enterprise picture: rich Salesforce contact data, sparse relationship intelligence. The account plans listed stakeholder names; nobody could say with confidence which of those names would defend the deal at the buying committee.

The team built its first relationship map for one of the largest accounts. The buying committee turned out to be 23 stakeholders across four business units and three regions. Of the 23:

The map exposed the structural risk: thirteen of the 23 stakeholders had no green relationship with anyone on the account team. A reorganization on the customer's side — which happened six months later — would have reset the account.

Eighteen months later, after running the map quarterly and assigning stakeholder ownership across the account team, the green-cell coverage had moved from four to thirteen. One of the original champions had moved to a different business unit, taking the relationship with them; the map flagged the loss in real time, and the account team rebuilt coverage in the new buying center before the next renewal.

The KAM's read at that point: the discipline did not make any individual conversation easier. It made the team honest about which relationships actually existed. The lesson was not about the coverage number. It was about the cadence — running the review every quarter was what made the map a planning tool instead of a deck. Airbus's strategic account program runs the same pattern at scale, with relationship mapping wired into the SAMA-styled account plan as the structural input.

FAQ

Common questions

What is a relationship map?

A relationship map is a structured visualization of the people inside an enterprise account who shape a buying decision — who they are, what role they play, how they connect to each other, and how strong each connection is to your team. It is not a contact list. A flat list of names, titles, and emails tells you who exists; a relationship map tells you who matters, who they listen to, and where the gaps in your coverage are.

What is relationship mapping in sales?

Relationship mapping in sales is the discipline of identifying, classifying, and visualizing every stakeholder who influences a deal or an account, then assessing the strength of your team's relationship with each one. The output is usually a two-layer view: an org chart showing reporting lines and influence, and a relationship matrix showing connection strength between stakeholders and your team. Enterprise sales teams use it to expose blind spots, plan stakeholder coverage, and protect accounts when a champion leaves.

What's the difference between a contact list and a relationship map?

A contact list records who exists in an account; a relationship map records who matters, what role each person plays, and how strong your relationship is with them. The list is a directory; the map is intelligence. Most enterprise teams have both — a Salesforce contact object full of names, and almost no structured view of which of those names is a decision-maker, an influencer, a blocker, or a champion.

How do you build a relationship map?

Build a relationship map in five steps: define the scope (one deal, one buying center, or a full account), identify every stakeholder who influences the decision, classify each by role (decision-maker, influencer, blocker, supporter, champion), score the strength of your team's relationship with each one (often red / yellow / green), and connect them to each other so reporting lines and informal influence are both visible. Refresh the map on a defined cadence — quarterly for strategic accounts — because buying committees change faster than CRM contact records do.

What is sales relationship mapping?

Sales relationship mapping is the same discipline applied at deal or account scope: building a structured view of the buying committee for a specific opportunity, scoring the team's coverage of each stakeholder, and using that view to plan next-best actions. It sits inside broader account planning, alongside white space analysis and MEDDPICC qualification. Sales relationship mapping is what turns a deal review from "how do you feel about this one?" into "who haven't we covered, and what would change that?"

What is customer relationship mapping?

Customer relationship mapping is the account-level version of the discipline — applied not to a single deal but to the entire customer relationship across business units, geographies, and time. It captures who in the customer's organization your team has met, who they have not, where the relationship is strong, where it is fragile, and where a single resignation would reset the account. Strategic account programs run customer relationship mapping continuously, not just at deal time.

Is there a relationship mapping template?

Most enterprise sales teams use one of two relationship mapping templates: a stakeholder matrix (rows for stakeholders, columns for influence × support, cells color-coded by relationship strength), or a stakeholder org chart (boxes for stakeholders, lines for reporting and informal influence, color-coded by your team's coverage). Both work. Spreadsheet templates are fine for a first pass, but the template only earns its keep when it lives inside the same system as the rest of the account data — usually Salesforce — so it stays current as the account changes.

What relationship mapping software or tools are available?

Relationship mapping software falls into three categories: manual diagramming tools (Lucidchart, Visio, slide decks); CRM-adjacent add-ons that draw an org chart from contact data; and Salesforce-native account-planning platforms that hold relationship maps as structured records alongside accounts, opportunities, and account plans. The category matters. A diagram in a slide is documentation; a relationship map as a Salesforce record is operational data — it changes the moment a contact is added, and it is visible in pipeline review.

How is relationship mapping different from an org chart?

An org chart shows the formal hierarchy — who reports to whom, who sits in which division. A relationship map adds two layers on top of that: stakeholder roles relative to your deal (decision-maker, influencer, blocker, supporter, champion) and connection strength to your team (red / yellow / green). The org chart is the skeleton; the relationship map is the org chart with role and coverage data laid over it. Most enterprise teams build them together, as one view.

How often should you update a relationship map?

Quarterly for strategic accounts is the right baseline. Buying committees can shift inside that window — reorganizations, new buying-center additions, executives leaving — so anything slower than quarterly produces a map that is wrong by mid-year. Active deals warrant a refresh after every meaningful interaction with a new stakeholder. The cadence matters less than the discipline of treating the map as a live record, not a deliverable that gets built once and pasted into the account plan.

Can AI agents keep a relationship map current?

For the data-keeping part of the work, increasingly yes. AI agents can read activity history, calendar invites, and email patterns inside Salesforce to flag new stakeholders, score the strength of recent engagement, and surface gaps where a stakeholder has gone quiet. They cannot replace the strategic read — deciding whether a contact is a champion or a coach, or whether a quiet executive is a sleeping risk or a passive supporter, still requires human judgment. The most useful pattern is AI Agents handling the map-keeping work, with the account team owning the role classification.

Related

Keep going

See your stakeholder coverage as a live record, not a slide.

A 5-minute walkthrough of ARPEDIO's relationship mapping running natively on Salesforce — no form, no setup.

Watch Demo Let's Talk